3 Tools for Dashboarding and Reporting
I needed dashboards for my MVP, if you do too, take a look at these
So you think you need some charts and graphs
Almost always you'll find that you need to report and measure engagement with your customers. You may at times find you need to internally analyze some business process. Also in other cases like mine, you may want to white label a dashboard and share it with your users, because that may be your entire product.
You of course could build this yourself, but likely you are going to be better served to leverage a dashboarding product.
Considerations and Decision Matrix
For me the decision over which product to use boiled down to the following
- Was it easy to connect to an RDS SQL Backend?
- Was it easy to get my first Tabular View and Visualization working?
- Was it Open Source and Extensible?
- Was there an embedding feature to make white-labeling work?
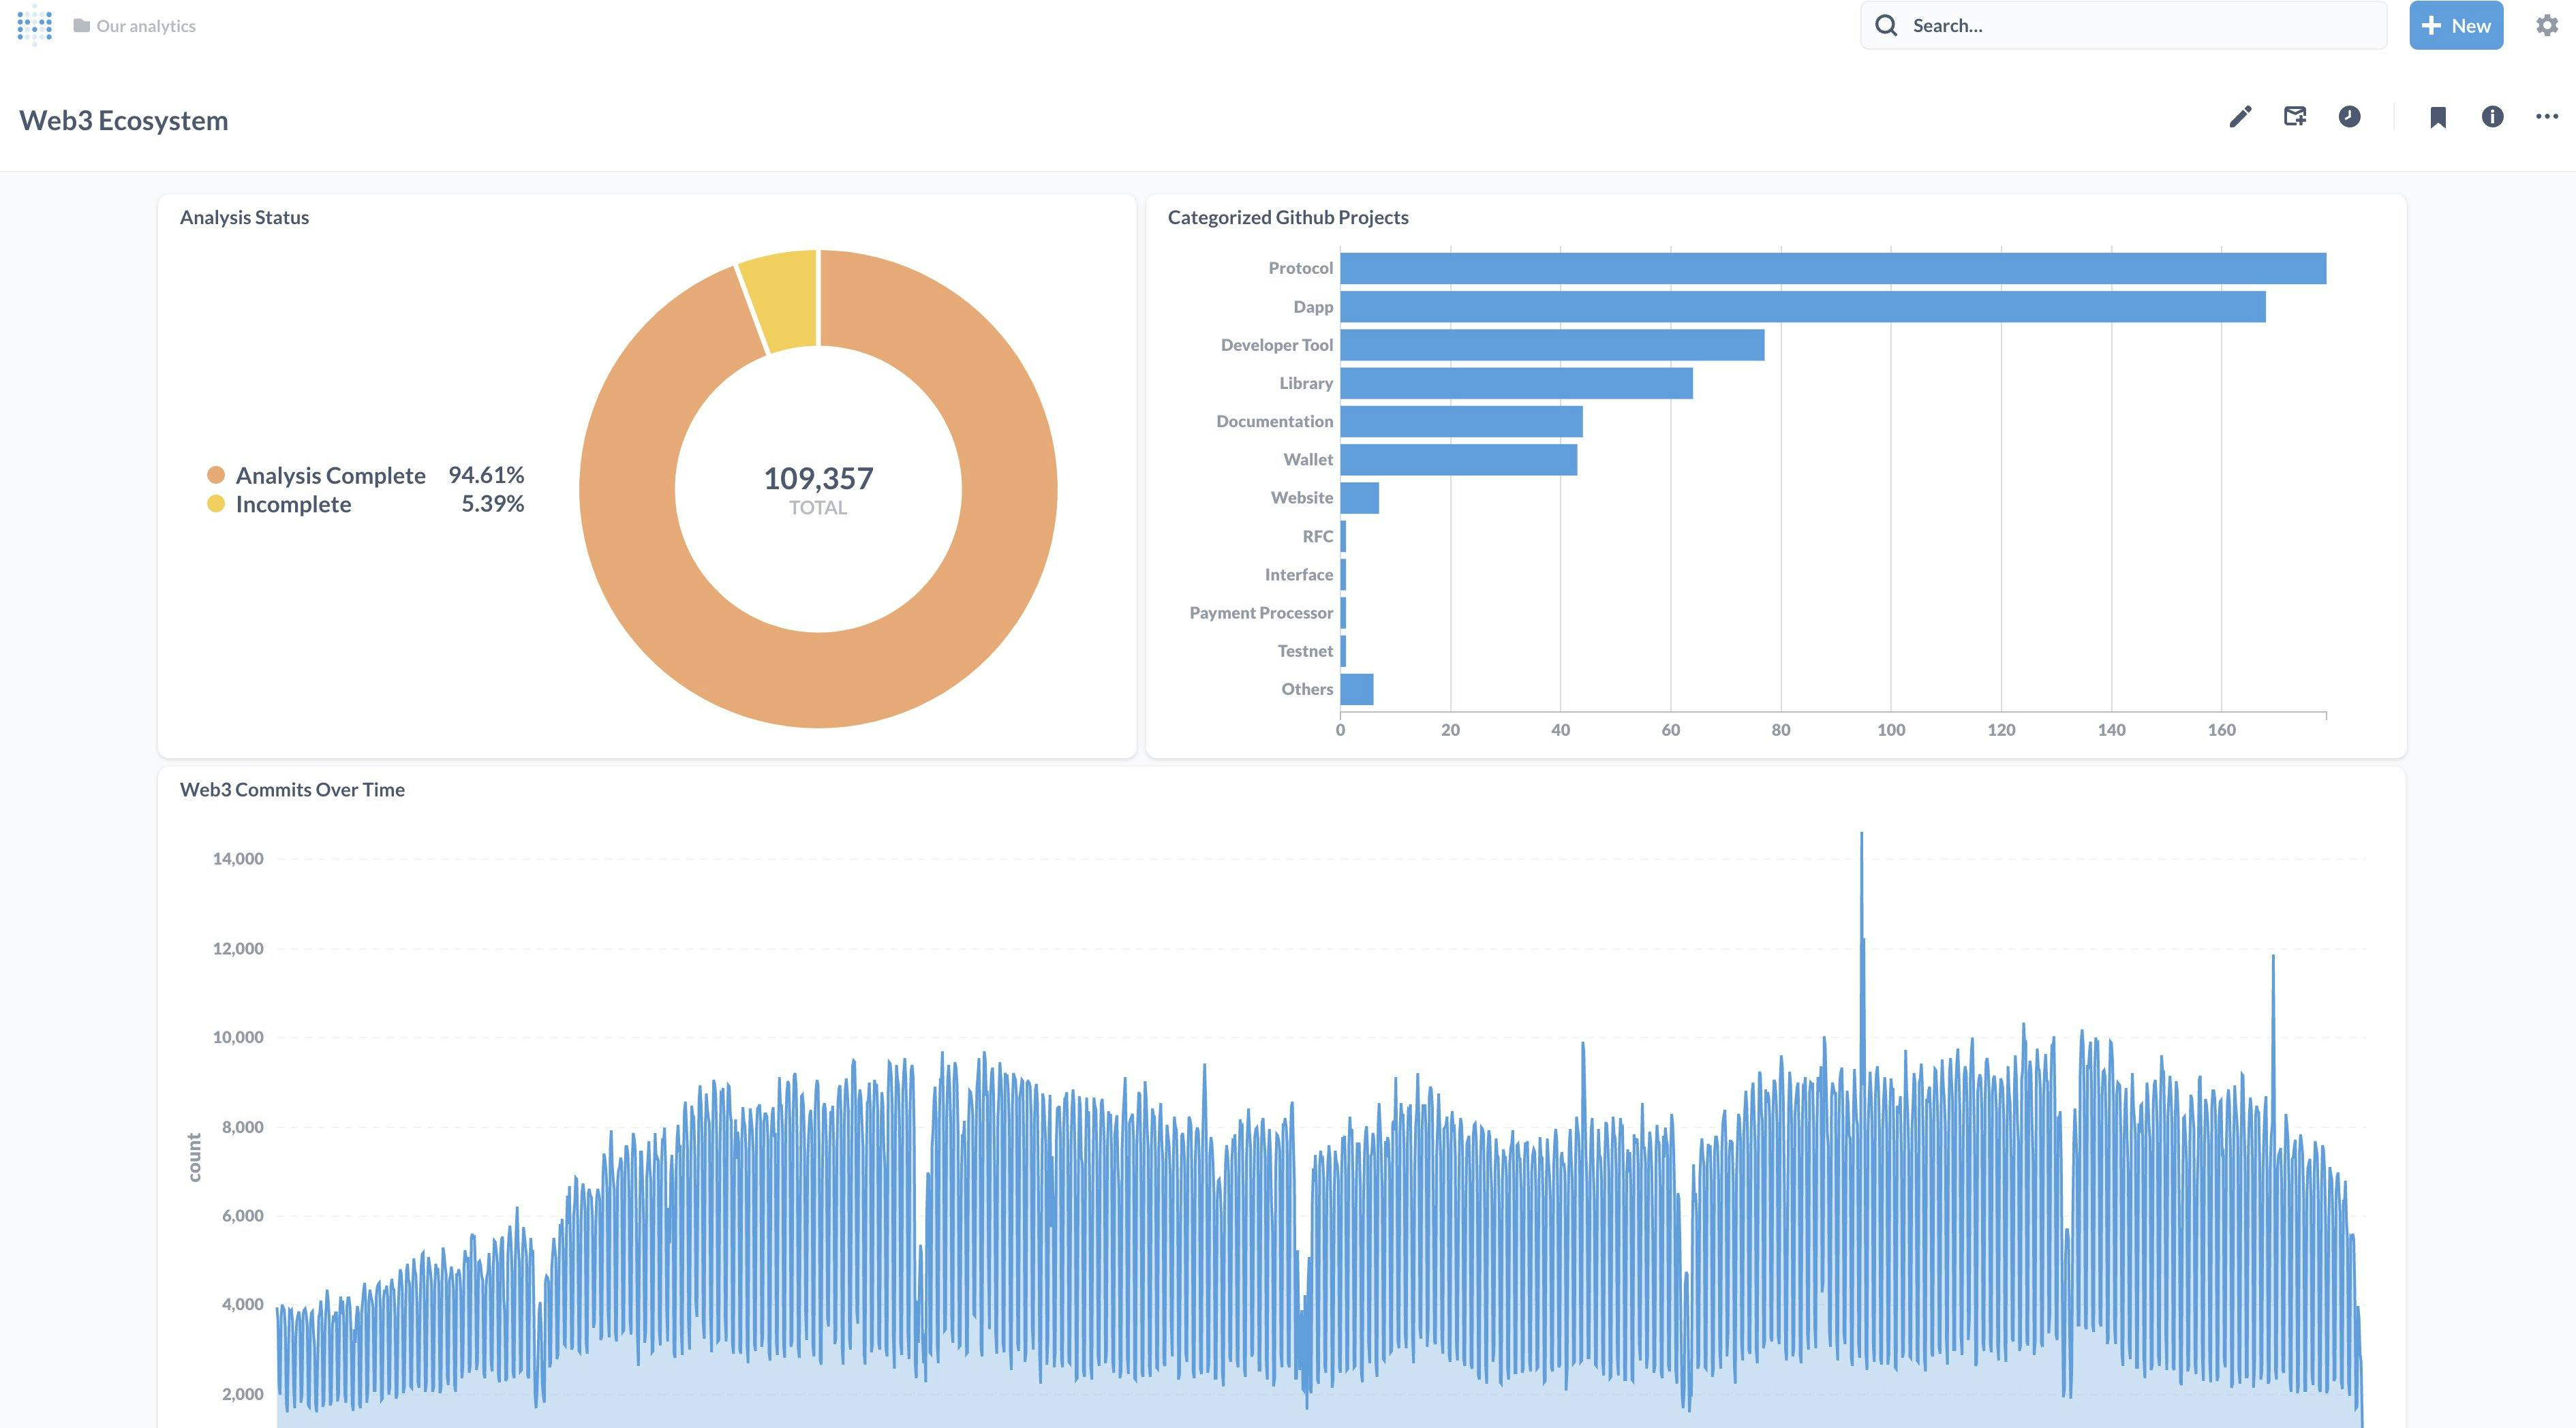
Metabase

This was my favorite of the mix. It ticks all the boxes of being easy to connect and getting a tabular and visual screen built (tldr; all of them were). The cool part of Metabase is it just felt cleaner in the way the application handled multiple-sized screens and supported mobile and web with one dashboard. Also, I noticed it was extensible and is a React application under the covers. This means that the ability to grow this platform significantly would have been very doable in the long term.
Some other technical notes:
- Their documentation was very good and easy to read.
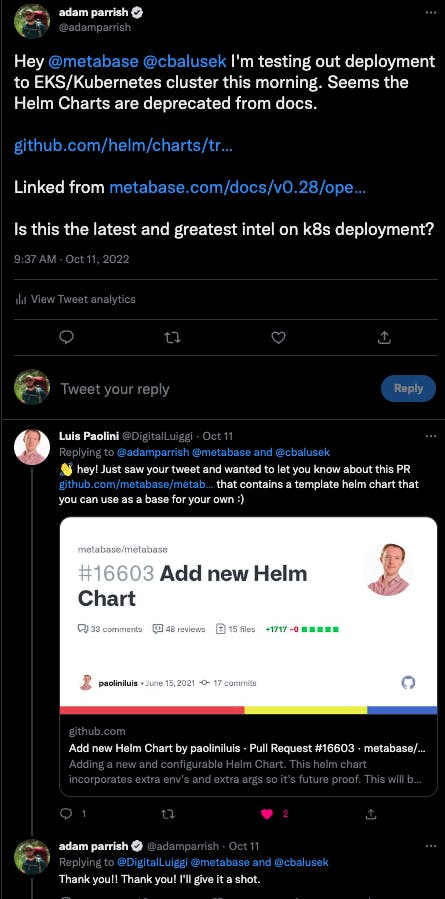
- Their support was super friendly on Twitter as you can see here
- It does work with Kubernetes so you can host it yourself (if that's a thing you want to do)
- You can pay to use their hosted / Whitelabel service which seemed like a good idea

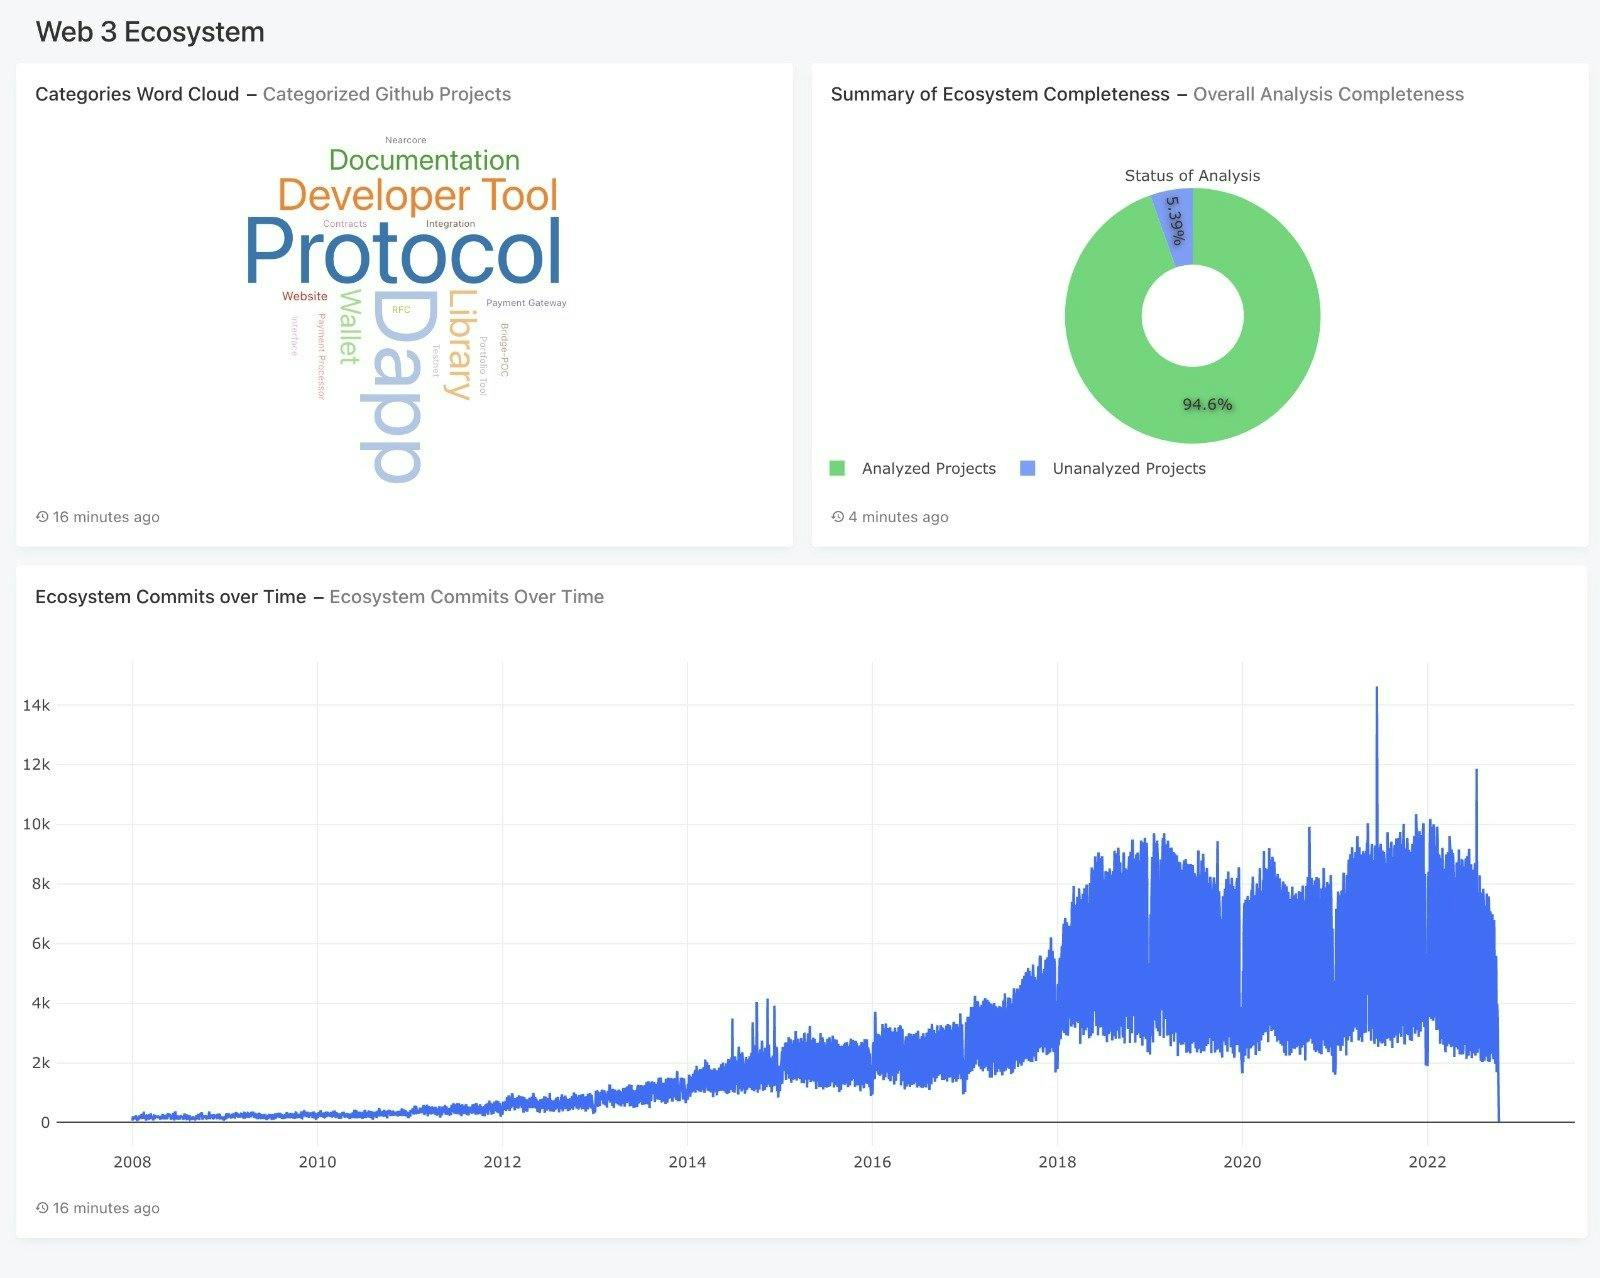
Redash

This was probably the simplest setup to get working with Kubernetes, in under 5 minutes as advertised. Again it ticked all the boxes of being easy. The place they seemed to not be working for me was that it didn't handle multiple screen sizes (like if someone clicks a shared dashboard link on a phone). Also, it didn't seem to support embedding or white labeling. This means that for internal use this would be great, but for solving for external use cases it's a no go without using iFrames and some serious jankiness. I welcome someone telling me I'm wrong here, so if so please comment.
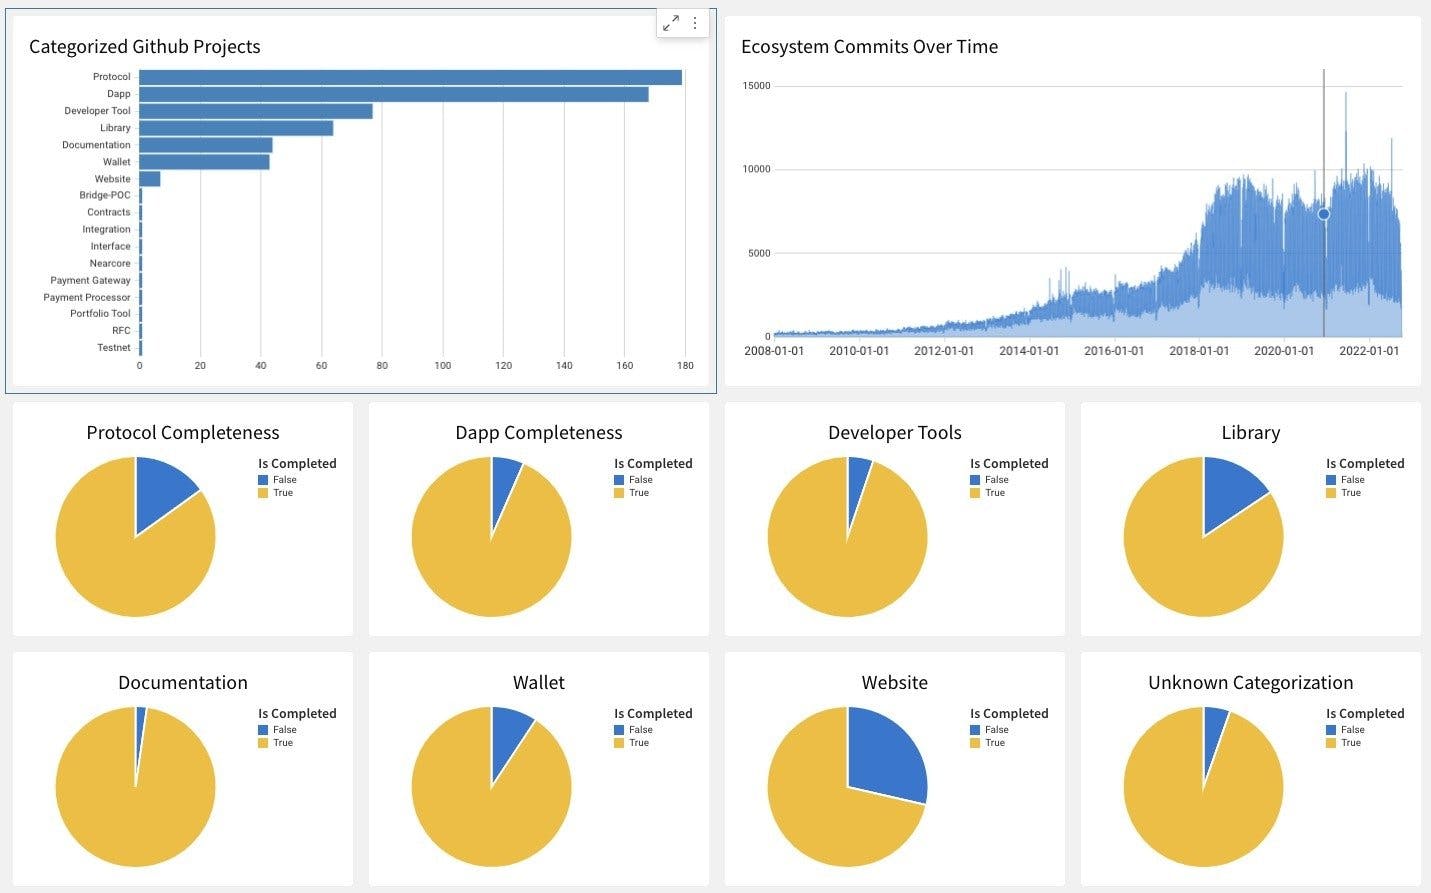
Sigma Computing

This company was incredible to me as I worked on my startup and MVP. I probably used more SigmaComputing than any other dashboarding seriously. So although they aren't my favorite from a tech stack perspective, I used them exclusively. Some features I was incredibly impressed by:
- Materialized Views
- Shared Data Sets (for scaling your data team)
- Support, Support, Support - they have great support via chat.
They again ticked all boxes except the extensibility of react components. I'd like to be able to code my own widgets and visualizations for inclusion. If you can live with their out-of-the-box components, they are extensive. Also, it's worth noting that all platforms have data limitations (like showing 15 years of bars at a weekly granularity). Sigma handled it very elegantly and chances are if you are displaying that much data, maybe you shouldn't.
Other Contenders
Of course, you could have tried Tableau and Power BI but they both failed the extensibility test for me, however, maybe I missed something. I have been ever impressed by some of the dashboards I've seen built in PowerBI and may want to revisit that in the future.

